Our philosophy
We strive to help our customers achieve their multi-cloud dream.
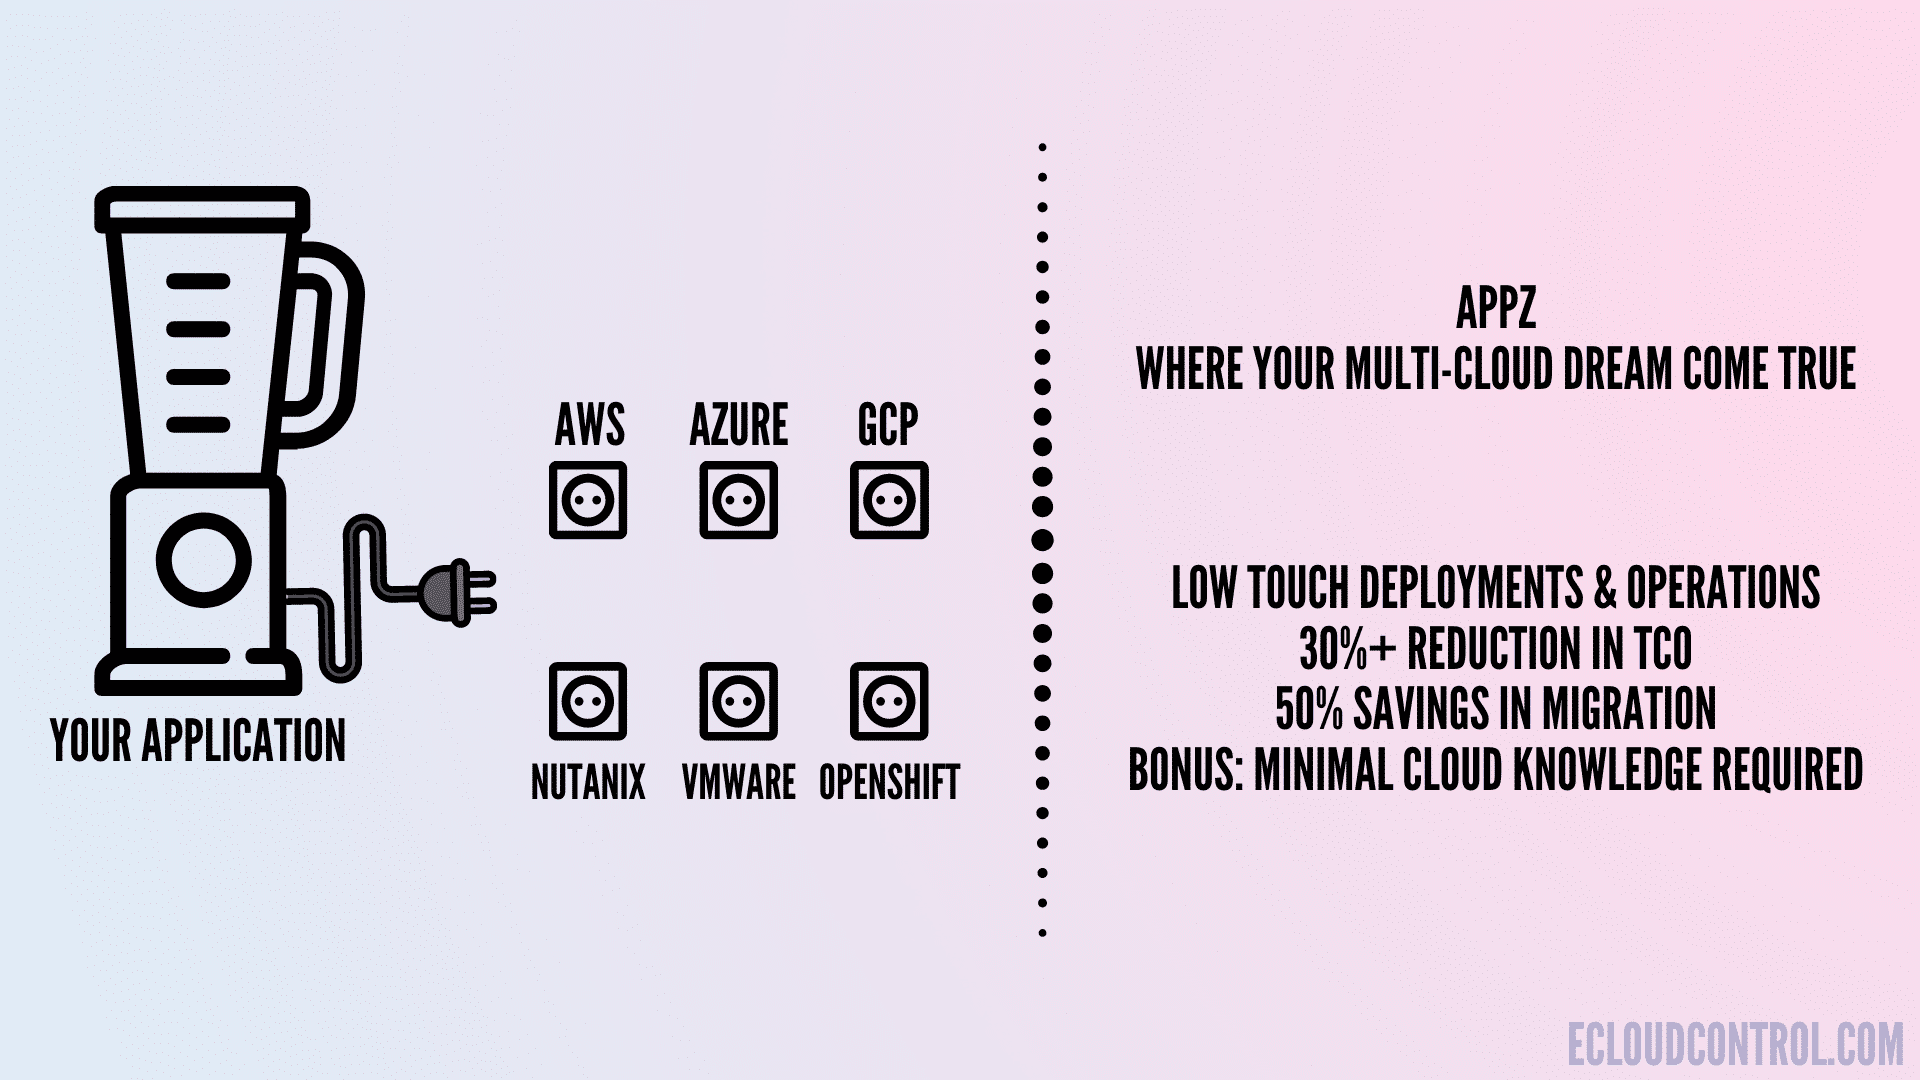
INTRODUCTION TO AppZ 2.0
AppZ, our platform, and the prefabricated image templates we call AppZ Stacks are built from the ground up to be cloud-agnostic. These templates are secure, curated with all the safeguards required to meet your multi-cloud goals as quickly as possible and at the lowest possible cost of ownership.
AppZ Use Cases
AppZ is a low-touch cloud platform. AppZ enables our customers to achieve one or more of the following use cases:
- Create and manage landing zones in the Cloud - Every business needs to have a secure landing zone in the Cloud; otherwise, the Cloud could be a very risky and expensive proposition.
- Greenfield application development - New ideas can be implemented in the Cloud with faster time to market using AppZ. Just hire developers no need to hire/spend money on DevOps and CloudOps.
- VM to VM and VM to Kubernetes migration - Migrate workloads currently running in VMs to Kubernetes with ease. Our customers have saved up to 70% in migration spent using AppZ.
- Cost optimization - If the workloads are already running in VMs in the Cloud, AppZ helps migrate them to more cost-efficient Kubernetes with minimal changes in the workloads.
- Lowtouch operations - Using our SRE-as-a-Service, workloads migrated using AppZ can be managed using a highly secure and efficient operational model, reducing the total ownership cost. Learn more about SRE from REDHAT.
- Custom Cloud Solutions - When you want to develop, deploy and manage custom cloud solutions with integrations to native and third-party services, you can use custom AppZ Stacks to achieve that with agility, security and predictability.
BENEFITS OF AppZ
- Improve efficiency & productivity across the development life cycle.
- Faster speed and consistency.
- Reduced management overhead.
- Enforce best-practices.
- Achieve standardization.
- Implement version controls.
- Achieve a high level of Automation.
- Improve security.
- Maximize auditability and traceability.
- Apply workflows, approvals, reviews and validations.
- Achieve consistency.
- Streamline testing & quality control process.
AppZ MODULES
- AppZ AUTOMATION
Swiss army knife of automation tools blended into one - Support Ansible, Terraform, Docker, Helm, Python & Bash.
- AppZ STACKS
Pre-fabricated, pre-tested migration and deployment templates. Unique customization layering mechanism.
- AppZ ENGINE
Designed to scale, event-driven architecture, plug-and-play integration, auto-upgrades.
- AppZ ALERTS
Rules-based alerts generation, configure using GitOps, integrate with incident management, and auto-workflow.
- AppZ GITOPS
GitOps engine + CI/CD, enables Infrastructure-as-Code, Configuration-as-Code & Policy-as-Code.
- AppZ DASHBOARD
Change log, build log, deployment logs, scan results, audit logs, system logs, and more.
- AppZ OBSERVABILITY
Leverages popular tools Prometheus and Grafana with Alert Manager for maximum visibility and operational efficiency.
- AppZ COMPLIANCE
Policy as code, drift prevention, and alerts, integration with SIEM, audit log, activity logs, separation of duties
AppZ USER MANUAL
The Cloud Control Solutions AppZ Platform enables developers to leverage the Cloud and Kubernetes platforms in hours without learning any technologies or worrying about the underlying complexity. AppZ's major goal is to enable developers to focus on their code base while AppZ handles the development, deployment, and day-to-day monitoring of the apps.
We will go through how the AppZ platform is designed and how the application deployment process is carried out in this section.
AppZ DASHBOARD
When developers log in to the AppZ dashboard after user activation, it displays the access to various environments as well as how apps are built and deployed. Each environment has a Pod where the containers for the apps are hosted.
- AppZ Screen
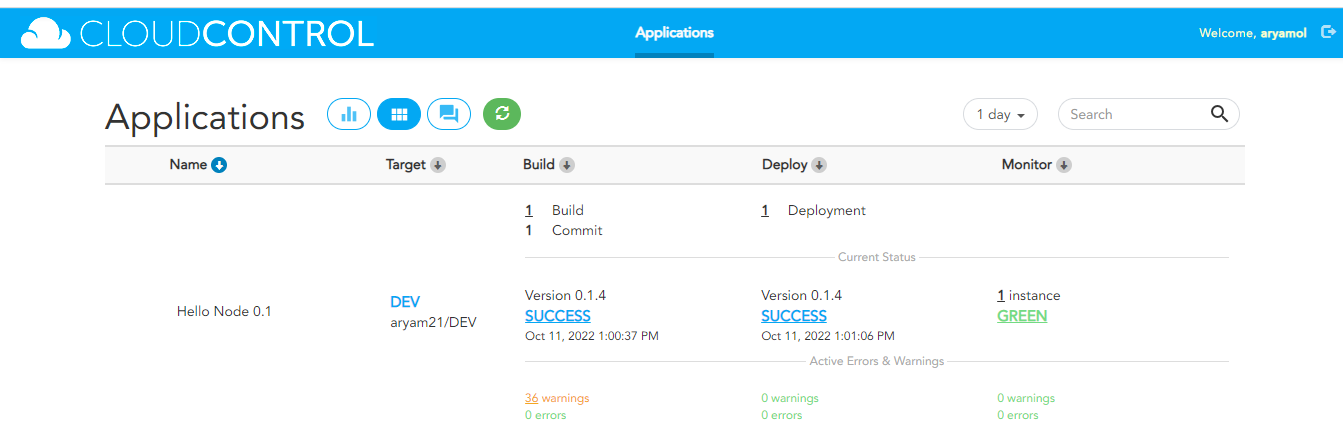
Fig: AppZ Screen
The AppZ dashboard is shown above. The name of the category represents the name of the application that needs to be built and deployed. For example, under the category target, developers are assigned to multiple environments (development, QA (Quality Assurance), and Prod (Production), each with its namespace. Then there's the build category. As seen above, 1 represents the number of apps that have been built and committed. Following that, the application's version and build date are shown. Under the deployment category, 1 represents the number of apps deployed, the application version and status, and the date of deployment. The last category is monitoring, which provides real-time access to the application's entire status.
- Build Related stats
This is where images are built. Users can build the applications and upload the code to GitHub/GitLab with a unique commit name. The build can be either successful or fail.
- Observability stats
Observability integrates metrics visualization and analysis with monitoring, alerting, and logging. It provides precise insights into the real-time performance of Kubernetes clusters and applications, enabling development teams to take prompt and informed actions. Observability is the ability to infer the internal states of a system from its exterior outputs. Monitoring and logging are part of Kubernetes' observability. Monitoring helps developers to keep track of how a system is doing. Logging makes diagnosis and troubleshooting easier.
- Grafana stats
Grafana is an open-source interactive data-visualization platform built by Grafana Labs that allows users to visualize their data through charts and graphs combined into one dashboard (or numerous dashboards) for better interpretation and understanding. Users may also query and set alerts on your information and metrics from wherever they are stored, whether in traditional server environments, Kubernetes clusters, other cloud services, etc.
Grafana provides the following common features:
Visualize : Grafana provides a wealth of visualization tools to assist you in understanding your data, from graphs to histograms.
Alerts: Grafana allows you to specify thresholds graphically and get notifications through Slack, PagerDuty, and other services.
Unify: You may combine your data to gain more context. Grafana natively supports hundreds of databases.
Open-Source: It is entirely open-source. Grafana Cloud may be used, or it can be readily installed on any platform.
Explore Logs: You can rapidly filter and search through the complete list of logs by using label filters.
Dashboards for display: Use templated or custom reports to visualize data. Create and distribute reports:
Create and distribute reports: Create and distribute reports to your customers and stakeholders.
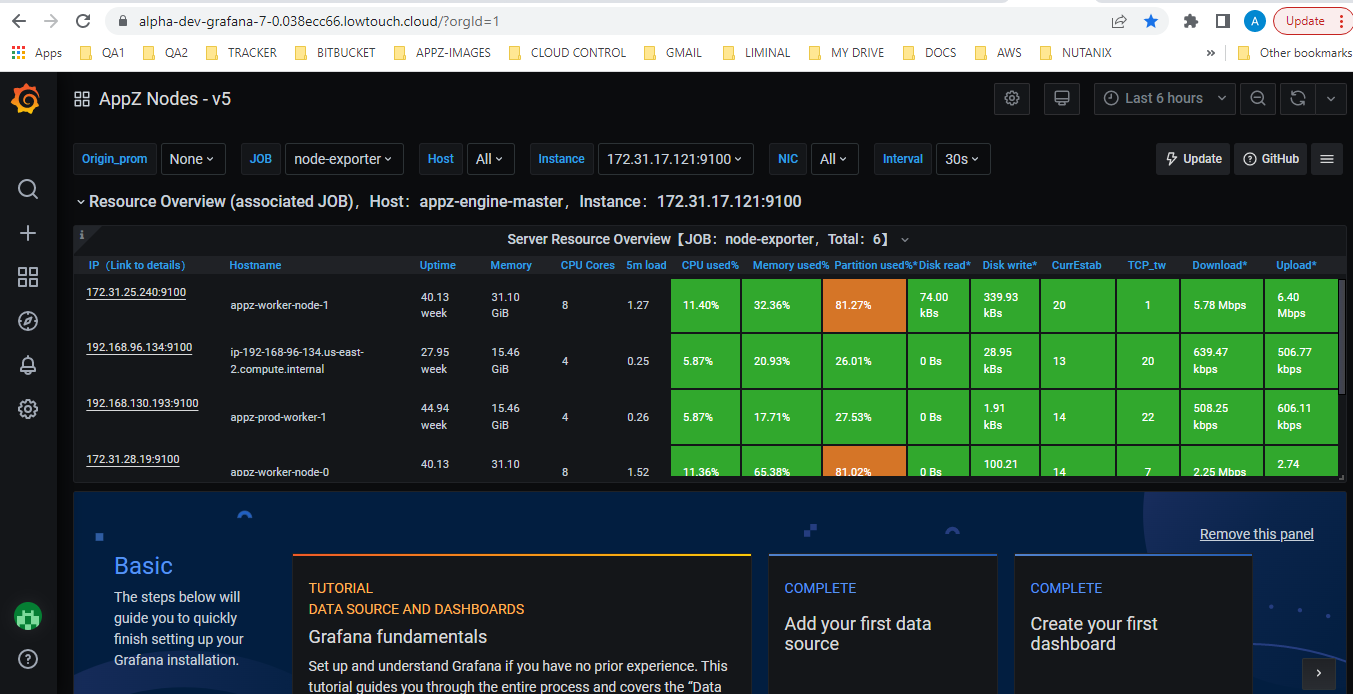
Fig: Observability and grafana in AppZ
In this section, we will discuss the pod and its elements.
1.Pod
A pod is the smallest deployable item created and managed by Kubernetes. Pods are made up of one or more containers (such as Docker containers) that work in tandem. Pod is a shared execution environment, which means it contains a set of resources that all containers in the Pod share. Among the resources offered are IP addresses, ports, hostnames, sockets, RAM, volumes, and others.
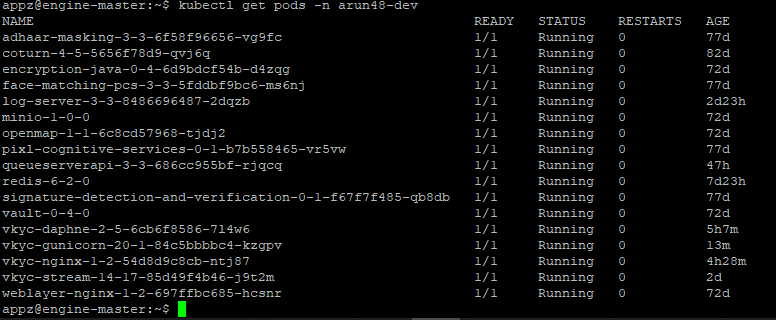
Fig: Pod
1.1 Pod elements
Each pod will have three environments: development, QA (Quality Assurance), and Prod (Production). All of these are the developers' goals. Each developer is assigned a namespace in each environment. To run the pod and generate the apps, the developers must first validate their namespace.

Fig: Namespace
1.2 Build
At this point, the actual development (image build) of the applications begins. A commit name will be assigned to each build here, where developers need to send the code to GitHub/GitLab. If the build is successful, it will be displayed in blue, and if the build is a failure, it will be shown in red.
1.3 Deploy
This stage is similar to Build in that a commit name is assigned to each application delivered, which the developers need to deploy. If the application is successfully deployed, it will be shown in blue, while failure will be displayed in red. Deployment is successful means the applications(pod) are successfully running in the containers.
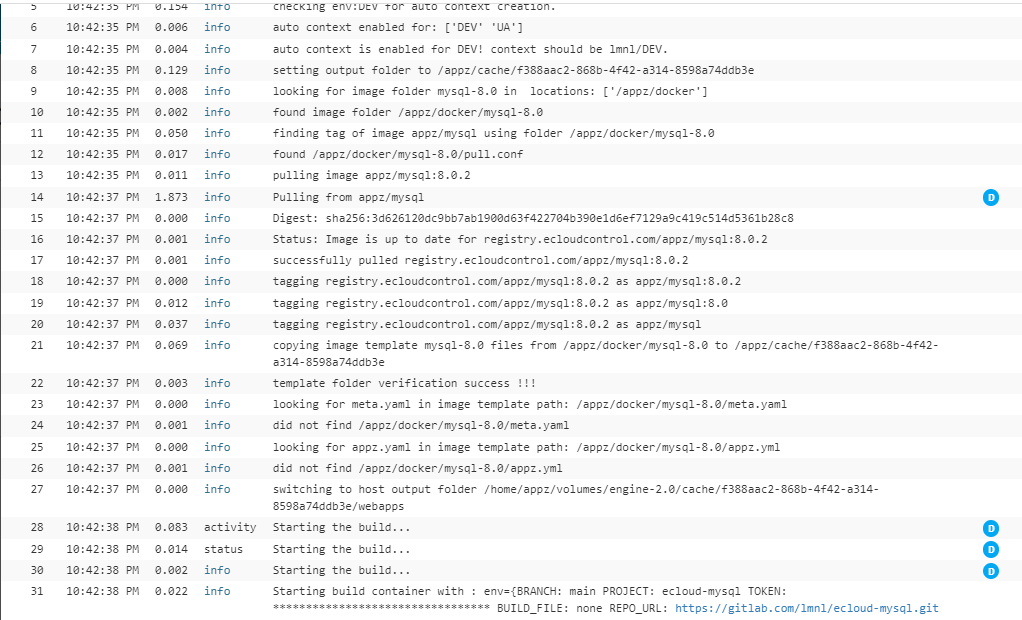
Fig: Build and deployment
1.4 Log
Users and developers will be able to access the whole log of the apps produced, executed, and deployed here. One of the most interesting aspects of the AppZ platform is the ability to view the log and charts. The developers can identify where the error occurred and how to fix it in each log. The log also allows developers to see the CPU, Memory, and resource status.

Fig: Monitoring log (CPU and Memory)

Fig: Monitoring log
Learn more at eCloudControl.com. Would love to hear from you. Please follow us on LinkedIn or write to us directly to appz@ecloudcontrol.com.